
eBay Sell-Through Rate: How to Calculate It and Use It to Pick Stock
Learn how to calculate eBay sell-through rate, use Product Research to evaluate market demand, and identify products worth sourcing. Explore the differences between market sell-through, sold-to-active ratios and inventory turnover, with practical tips for comparing competition, selling prices and profitability before investing in stock.
ON THIS PAGE
- 1What does sell-through rate mean for an eBay seller?
- 2Two practical formulas—and why you should not mix them
- 3Where to find eBay’s own sell-through information
- 4Why active listing prices can mislead stock buyers
- 5Build a clean comparable set before calculating anything
- 6How to calculate a do-it-yourself sell-through proxy step by step
- 7Example: evaluate three possible products with the same method
- 8Use the rate to judge demand, supply and competition together
- 9Compare actual sold prices, not just averages
- 10Calculate expected profit after all real costs
- 11Separate demand speed from cash conversion speed
- 12Seasonality can make a strong rate misleading
- 13The dangers of researching broad keywords
- 14How many sold listings are enough evidence?
- 15A sourcing scorecard that combines demand and profit
- 16Category example: replacement parts
- 17Category example: apparel and home textiles
- 18Category example: collectibles and limited editions
- 19Category example: electronics and refurbished goods
- 20Use sell-through evidence to plan replenishment
- 21Watch for red flags hidden behind an attractive rate
- 22Connecting stock choice with the listing’s actual buyer experience
- 23A thirty-day stock-selection and validation plan
- 24How BoostOnTime ETB fits the sourcing-to-selling workflow
- 25A supplier negotiation checklist informed by market research
- 26Keep a post-purchase feedback loop for future stock decisions
- 27Make the decision resilient to an unexpected downside
- 28Mistakes to avoid when using sell-through rate
- 29Frequently asked questions about eBay sell-through rate
- 30Final takeaway: source demand, then earn the sale
Buying stock for eBay is easy to romanticize. You find something inexpensive, see a few expensive active listings, and imagine the margin. Then the inventory sits for months while storage, working capital, packaging and time quietly consume the potential profit. Sell-through rate is one way to test whether a product has evidence of actual demand before you commit money.
Quick answer: eBay sell-through rate helps estimate how actively comparable items sell relative to the supply you are measuring. Use eBay Product Research for its reported market sell-through metric, or calculate a clearly labeled sold-to-supply proxy from comparable sold and active listings. Keep the timeframe, filters and denominator consistent. Use the result alongside actual sold prices, fees, shipping, condition, seasonality, competition and your own inventory turnover. A high rate can indicate demand, but it does not guarantee a profitable purchase.
What does sell-through rate mean for an eBay seller?
In ordinary language, sell-through rate describes how much available merchandise is turning into sales over a defined period. For sourcing, sellers often ask: ‘How much of this type of product sells compared with how much is offered?’ For internal inventory management, they ask: ‘How quickly do the units I own leave the shelf?’ Both are useful, but they are not necessarily the same calculation.
The distinction matters because eBay Product Research reports a sell-through metric for qualifying recent searches, while sellers may construct different ratios from sold and active counts. An active listing can hold multiple units and remain active after dozens of transactions. A sold listing may represent one item or a multi-quantity offer. An auction can end without a buyer. Two independently collected search counts may not even represent the same population.
Never treat a homemade sold-to-active percentage as an exact reconstruction of eBay’s internal Product Research methodology. Label it a proxy, record how it was measured, and use it directionally. If your goal is cash planning inside your own business, calculate unit sales and inventory turnover from your inventory records instead of relying on search-result listing counts.
Two practical formulas—and why you should not mix them
Market sold-to-active proxy (illustrative): sold comparable listings observed in a stated period ÷ active comparable listings observed at a stated point × 100. If 45 matching sold listings appear in a ninety-day sample and 90 matching active listings appear when checked, the proxy is 50%. This is a convenient research indicator, not a guaranteed eBay-defined rate. The sold and active counts come from different windows, so the ratio can exceed 100% in a fast-moving or frequently replenished niche.
Your own unit sell-through (inventory planning): units sold during a defined period ÷ units available to sell during that period × 100. A simple, explicitly defined availability denominator might be beginning units plus units received, adjusted for transfers where necessary. If you began with 60 units, received 40 and sold 70, that period’s simple unit sell-through is 70%. This measures how the business moved actual stock, not how many eBay listings were visible.
Some teams instead track inventory turnover as units sold divided by average units on hand, or cost of goods sold divided by average inventory cost. Those measures can exceed 100% or be expressed as times per year. Do not label inventory turnover ‘eBay sell-through’ without explaining the difference. For a disciplined sourcing model, record which measure you use, why, and the exact reporting dates.
Where to find eBay’s own sell-through information
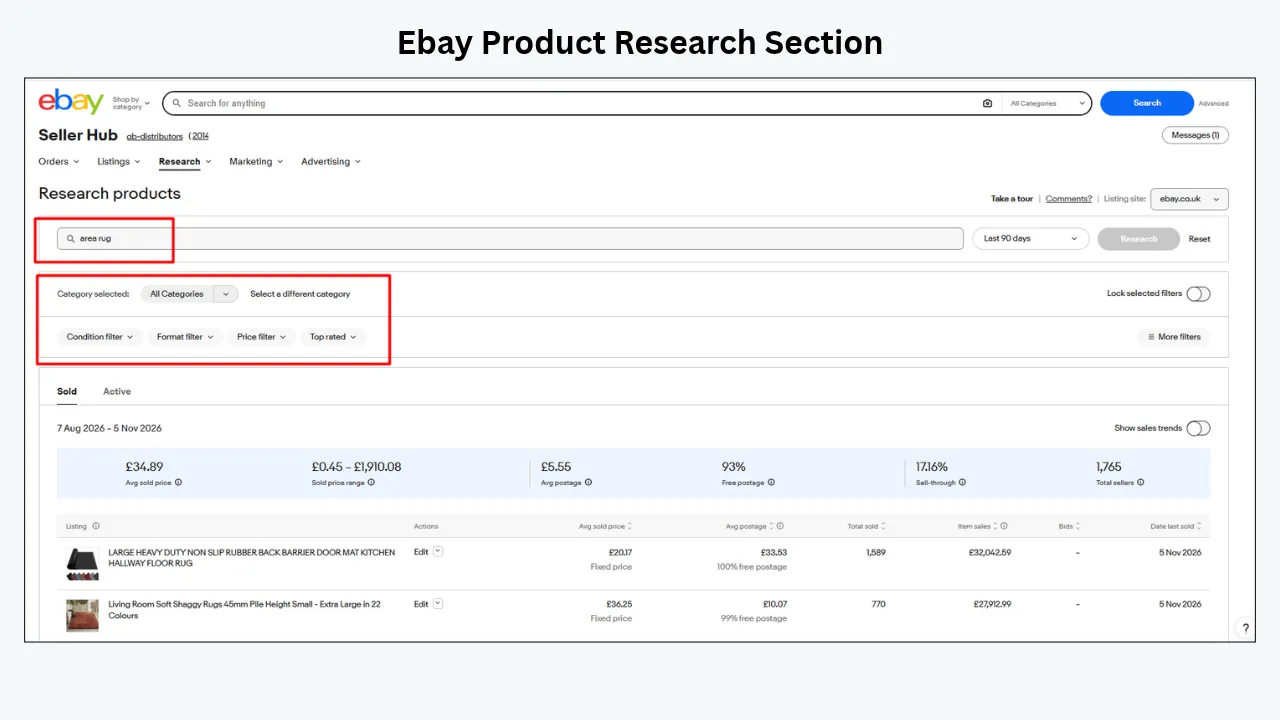
Open Seller Hub and use Research, then Product Research. On supported mobile experiences, Product Research is available through the eBay selling tools, though individual metrics and views may vary by device or interface. Enter the exact product or keyword, choose the appropriate marketplace and filter by category, item condition, brand and other identifiers. Review sold price, sales trends, seller count, shipping data and the available sell-through measure.
According to eBay’s Product Research Help page, the tool provides access to up to three years of historical sales information, but its sell-through metric is available for searches of items sold within the last ninety days. That is a critical nuance. Do not assume every three-year chart has an equivalent three-year sell-through percentage. Choose a recent research window when comparing rates, and use longer history to understand cycles and price trends.
Product Research offers more than an ordinary sold-items search. eBay states that it can report actual accepted Best Offer prices, average selling price, sold price range, shipping costs, seller participation and sales trends. These help distinguish a product that merely attracts ambitious asking prices from one that actually transacts at a viable price. Availability and exact features can vary; follow the interface currently shown in your account.
Why active listing prices can mislead stock buyers
Suppose you find a discontinued kitchen appliance for $28 at a local clearance event. On eBay, several active listings ask $95 to $120. That looks profitable until you examine sold transactions. Maybe the few actual buyers pay $48, and a listing that asks $110 has been sitting for months. The high asking prices demonstrate sellers’ hopes, not customers’ willingness to buy.
Before purchasing, look at completed sales for the same model, condition and included accessories. Use a realistic price range rather than the single most exciting sale. Ask whether the expensive sold result included extra components, original packaging or a rare color. Subtract the costs required to deliver your actual item to the buyer. A misleading active price can turn a thin-margin item into dead stock.
The same warning applies in reverse. A low active price may belong to a damaged item, counterfeit product or incomplete kit; it may not be a valid competitor. Product identity is everything. Broad keyword searches produce attractive statistics but weak sourcing decisions when the underlying matches are inconsistent.
Build a clean comparable set before calculating anything
The quality of a sell-through estimate depends more on search discipline than arithmetic. Start with a specific product query: brand and model for electronics; precise size and material for textiles; issue, edition and grade for collectibles; OEM number and fitment for parts. Filter to the marketplace where you will sell and match the condition you can reliably supply.
Exclude irrelevant accessories, incomplete sets, mixed lots, spare packaging and items whose price includes an unusual service. Separate auctions from fixed-price offers if their buyer behavior differs materially. Check whether multi-quantity listings dominate the market; if they do, a listing-count ratio is particularly fragile. The objective is a comparable group, not the largest possible sample.
Write a repeatable query log. Record search phrase, date, country, category, condition, filters, active count, sold count, price range and observations. If you revisit the opportunity a month later, you should be able to explain whether changed numbers reflect the market or your altered search. Even a small reseller benefits from treating sourcing research as a documented method rather than a memory of a promising screenshot.
How to calculate a do-it-yourself sell-through proxy step by step
Step 1: Define the exact opportunity. Write what you intend to sell: product model, condition, quantity per sale, packaging state and destination marketplace. ‘Gaming accessories’ is too broad; a specific replacement controller model is more useful. If you plan to sell refurbished units, do not mix those with new factory-sealed merchandise in the same estimate.
Step 2: Fix the period. A ninety-day sample is often practical for recent demand and aligns with the window where eBay says Product Research can provide sell-through. But seasonality may call for a complementary year-over-year study using sales history. Record start and end dates rather than labeling a moving search simply ‘recent.’
Step 3: Observe sold evidence. Use Product Research or appropriate completed-sales filters to see comparable transactions. Exclude false matches and distinguish sold listings from quantity sold whenever the data allows. Note the price buyers actually paid and whether shipping was included. Do not infer a product’s profitability from a few unusual high-end results.
Step 4: Observe current supply. Search active listings with matching filters. Count the relevant supply cautiously and note when multi-unit sellers dominate. A marketplace containing twenty active listings might contain twenty units or thousands of units. A simple listing count cannot reveal the true stock quantity in every offer.
Step 5: Calculate and label. Divide the two observed counts and multiply by one hundred. Write ‘sold-to-active listing-count proxy, ninety-day sold window, active snapshot on [observation date]’ rather than just ‘sell-through.’ Explain that this is not an exact official eBay metric or a forecast.
Step 6: Interpret in context. Compare several specific products researched the same way. Look at median sold price, seller saturation, seasonality, shipping burden and returns. If the proxy looks strong but the profit calculation looks poor, do not buy solely because the percentage seems exciting.
Example: evaluate three possible products with the same method
Imagine a reseller considering three clearance products. The numbers below are invented to teach the method, not measured marketplace data. Each row uses a ninety-day sold-listing observation and a same-day active-listing snapshot. We assume the queries are reasonably comparable, although the method still has listing-count limitations.
The board-game expansion appears strongest on the proxy, but 120% should not be interpreted as ‘120% of today’s inventory sold.’ It means the historical sold-listing count exceeded the current active snapshot. The market may be replenished repeatedly, inventory may have changed, and listing quantities may differ. Investigate whether authentic complete sets can be sourced at a price that leaves enough margin after shipping and fees.
The blender jug has more moderate demand, but exact compatibility and fragile-item shipping costs may determine profitability. The cushion cover appears slower, yet it may have low acquisition cost, cheap storage and easy shipping. An effective buying decision compares demand with unit economics and capital commitment rather than declaring the highest rate an automatic winner.
Use the rate to judge demand, supply and competition together
Sell-through evidence tells only part of the story. A niche can have strong sales and intense competition. If a few dominant sellers control pricing and offer faster fulfilment, a small entrant may struggle despite attractive demand. Conversely, a modest rate in a low-competition niche can be viable if customers pay enough and stock is cheap to carry.
Separate the number of sellers from the number of listings where possible. One seller can publish many variations, and one multi-quantity listing can account for significant sales. Look at who actually sells: are there many independent successful sellers, or only a few stores with strong brand recognition and inventory depth? The second pattern might require a differentiated offer or better sourcing terms.
Study the trend, not just today’s ratio. Rising sold prices with steady sales can signal genuine demand; falling sold prices with growing active supply may signal saturation. An attractive past rate can quickly become irrelevant if a new manufacturer releases a substitute or a previously scarce part becomes widely available.
Compare actual sold prices, not just averages
Average selling price is useful but can conceal a wide distribution. A $20 item and a $200 rare variant produce a $110 average if sampled carelessly. Look at the range, median when you can calculate it reliably, condition, accessories, shipping and volume at each price band. Ask which part of the distribution resembles the stock you can obtain.
For example, a seller buys ten used audio interfaces. The average sold result may be $140, but tested complete units with original power supplies drive the higher figures, while untested units close near $65. If the reseller lacks the equipment to test them, the relevant comparison is the lower condition tier. A good product decision begins with honest classification, not a fantasy of the best-case sale.
Use eBay’s pricing guidance to compare similar completed sales and consider acquisition cost. Maintain a conservative exit-price estimate and a higher-price scenario only when there is evidence that your item qualifies. Plan what happens if the item sells below the expected range or must be returned.
Calculate expected profit after all real costs
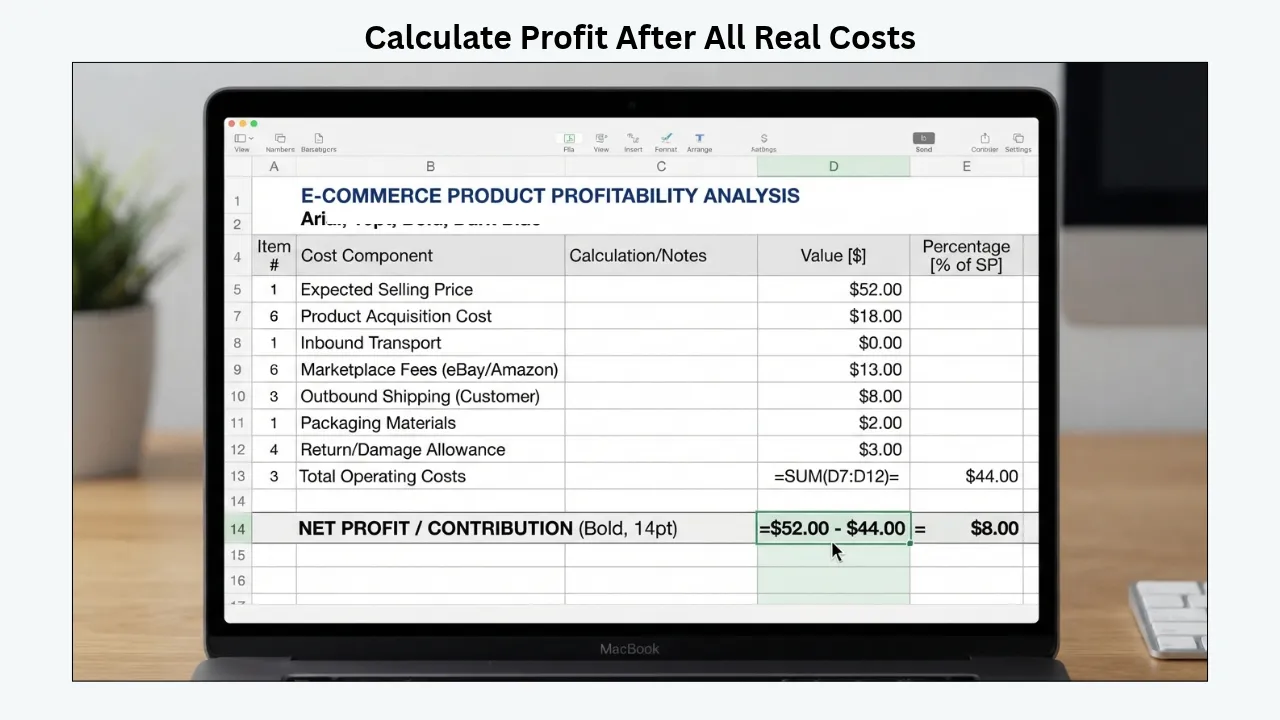
A product can sell quickly and still be a poor investment. Start with expected selling price, then subtract product acquisition, inbound transport, marketplace fees, advertising fees if used, outbound shipping, packaging, payment-related costs where applicable, labor and an allowance for returns or damage. Fee structures vary by category, account and location, so use current fee schedules rather than a universal percentage copied from social media.
Consider an illustrative item purchased for $18 and expected to sell for $52. If the combined illustrative expenses are $13 in selling fees, $8 outbound shipping, $2 packaging and $3 expected return-related cost, the contribution remaining after purchase is $8. That is not $34 profit, despite the difference between buy price and sale price. Verify actual fees and shipping quotes before committing.
Now add time. If the item requires thirty minutes to test, clean, photograph and package, the effective return on labor may be unattractive. If it occupies a large shelf for six months, its capital and storage burden rises. A lower-margin item that sells reliably with minimal handling can be a better business decision.
Separate demand speed from cash conversion speed
Sell-through sounds like a speed metric, but a market-wide ratio does not directly tell you how long your individual item will remain unsold. Your price, seller history, listing quality, condition and dispatch time determine whether you capture the available demand. Market demand can be strong while your specific offer is uncompetitive.
For cash planning, combine market data with your own days-to-sale history. Record listing date, sale date, inventory receipts, reorder points and stockouts. Group results by category and buying channel. A product that sold quickly last year may slow after the supply chain changes; update forecasts rather than treating the previous average as permanent.
An especially important distinction is sell-through versus inventory turnover. A company can sell 100 units in a month while carrying an average of 20 units through several replenishments. That indicates fast turnover, but a simplistic denominator based on one snapshot would suggest an impossible interpretation of stock. Use inventory systems to measure actual unit movement and market data to judge outside demand.
Seasonality can make a strong rate misleading
eBay demand is not uniformly distributed across the year. Holiday decorations, gardening equipment, school supplies and winter clothing can have predictable peaks. A ninety-day sample taken during peak season may make a marginal item appear like a permanent bestseller. Conversely, a slow-season snapshot may unfairly disqualify profitable seasonal stock that you can store cheaply and launch at the right time.
Use longer sold-price and volume history to identify peaks and troughs. eBay Product Research’s multi-year sales history can help you investigate those patterns. Compare equivalent months across years when available, but remain aware that changing product versions, macroeconomic conditions and category shifts can affect the comparison.
Create a seasonal buy calendar. Estimate when stock must be acquired, photographed and listed to capture demand, and when it should be marked down or liquidated. Account for lead times and storage. A ‘high sell-through’ product bought immediately after its peak can tie up capital until the next season, making a superficially strong rate commercially weak.
The dangers of researching broad keywords
Searching ‘wireless earbuds’ might produce a huge volume of sold results, but it does not prove demand for an obscure generic model with weak batteries. Searching ‘curtains’ says little about a niche fabric, exact drop or specific pattern. The broader the query, the easier it is to confuse general marketplace activity with demand for the product you can buy.
Use search specificity as a form of risk management. Begin with a narrow query that matches your exact item. Then expand gradually to understand substitutes and broader competition. If the exact SKU has almost no sold evidence, that uncertainty is itself useful. You may still test it, but do so with a small quantity and a strict maximum cash exposure.
Be careful with brand spellings, incompatible accessories and miscategorized items. A listing described as ‘for Brand X’ may be a third-party compatible part rather than genuine Brand X stock. Those categories can have different prices, return rates and legal obligations. Record the differences before estimating margin.
How many sold listings are enough evidence?
There is no magic sample size that eliminates risk. Five sold transactions over ninety days may be meaningful for a scarce collectible, but inadequate for a mass-produced accessory. A hundred sales may still be misleading if one seller dominates, prices are collapsing or the counted items are materially different from yours.
Look at both sample size and consistency. Do sales appear across multiple weeks and sellers, or only on a single unusual date? Are prices clustered within a usable range? Is the product’s condition comparable? Can you source repeatably? A strong case has several independent signals pointing in the same direction, not one exciting percentage.
For uncertain opportunities, use a test buy. Purchase a small quantity, list it accurately, track views and transactions, then expand only after observing real cash conversion. A sample order can uncover hidden costs, packaging problems, compatibility questions and return risk that desk research cannot show.
A sourcing scorecard that combines demand and profit
Use a consistent scorecard to compare opportunities. Score each dimension based on evidence, not optimism. Demand may be represented by Product Research sales activity and a carefully defined sell-through indicator. Competition considers current price pressure and strong incumbents. Profit considers realistic landed costs. Operations examines shipping fragility, storage and handling. Risk considers authenticity, defects, restrictions, returns and seasonal uncertainty.
Avoid reducing the scorecard to a false scientific certainty. A numerical score can help prioritize attention, but a critical failure such as product authenticity uncertainty or prohibited stock should override an attractive total. The point is to make trade-offs visible before paying a supplier.
Category example: replacement parts
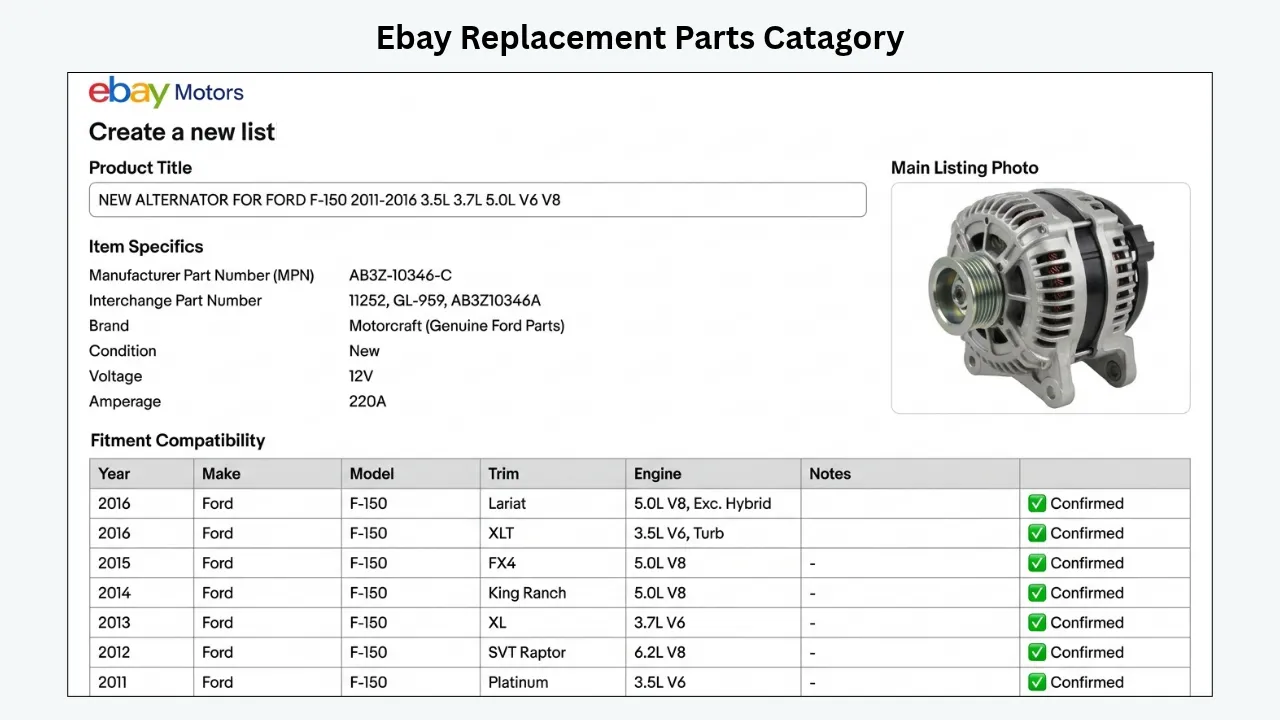
Replacement parts often have identifiable, intent-rich searches. A buyer may need the exact component to repair an appliance or vehicle, making precise model numbers more useful than generic category terms. Research must therefore filter by the actual part, compatible models and condition. A broadly similar component may not fit at all.
When a part has healthy sold evidence, check whether units are routinely available from manufacturers or whether the market depends on salvage stock. Inspect shipping fragility and the cost of handling returns caused by incorrect fitment. A well-priced part with unverified compatibility can generate expensive disputes. Include exact identifiers in eBay fields and a scannable compatibility section in the description.
Stock selection and listing quality interact here. Strong market sell-through suggests a potential opportunity; clear fitment information increases the chance that your offer captures it responsibly. Do not claim that a template changes market demand, but it can help explain a complex product after a shopper opens the listing.
Category example: apparel and home textiles
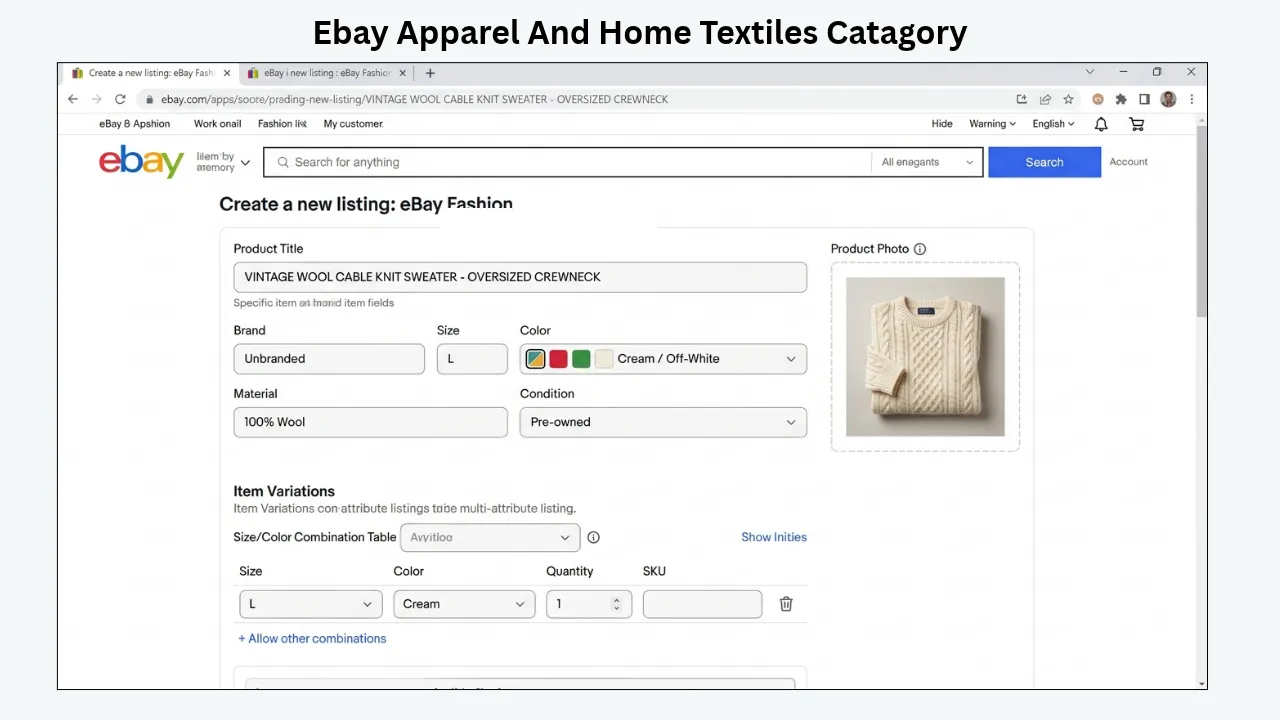
Apparel and textiles produce many near-substitutes, and small variations in brand, size, material and pattern can change demand dramatically. A broad search may report healthy sales even when the exact color or size you are buying is slow. Investigate the sold evidence for the relevant variant. Also consider return likelihood because fit and personal preference matter.
For clothing, actual measurements and truthful condition photographs can reduce ambiguity. For bedding, curtains and table linens, quantity per pack and finished dimensions are essential. Factor in packaging, storage volume and potential color mismatch. A textile with modest demand can still be profitable if it is cheap to store, easy to ship and sells consistently at a reasonable margin.
Never treat an attractive product photograph as proof of sell-through. Demand is evidenced by transactions, not how good a product looks in a supplier catalog.
Category example: collectibles and limited editions
Collectible markets often have thin samples, high variance and condition premiums. One sale at a spectacular price can distort an average. Scarcity can create high interest but low transaction frequency, especially if buyers care about edition, signature, authentication, grading, original box or provenance.
Use the longest relevant sales history available to understand rarity and pricing cycles, while remembering that eBay’s published sell-through metric may be available only for recent search windows. Match condition precisely. Build a conservative resale range and choose a holding period you can financially tolerate. If you cannot verify authenticity, do not assume the highest market tier applies to your item.
A small number of verified sales can justify a cautious purchase, but not the same replenishment plan as a fast-moving commodity. Capital discipline matters most when cash may be tied up for months.
Category example: electronics and refurbished goods
Electronics can show high sold volume while creating costs through testing, battery issues, missing chargers, data security, software locks and returns. Research separate model generations and storage capacities. A slight variation in processor, connectivity or firmware can change both price and buyer demand.
Build a standard intake checklist before sourcing. Verify functionality, record serial or model information where appropriate, check included accessories and apply accurate condition grading. Calculate labor cost per unit and the probability of returns. A high sell-through opportunity that requires extensive repair may be inferior to a slower, simpler product.
For refurbished stock, your evidence must match your offer. If sold data mostly represents professionally tested items with accessories, that is the standard you must meet—or you should model a lower selling price.
Use sell-through evidence to plan replenishment
Once a tested product begins selling, switch from one-time sourcing to inventory planning. Record average weekly unit sales, lead time, variability and minimum order quantity. A reorder point can be approximated by expected demand during lead time plus a justified safety buffer. The buffer should reflect uncertainty rather than a random desire to keep shelves full.
For example, if a product sells an average of five units a week and your supplier typically takes two weeks, expected demand during lead time is ten units. A safety reserve might be appropriate if delivery times vary or demand spikes. But the correct buffer depends on actual variability, storage costs and service goals. A fast market sell-through signal does not by itself tell you how many units to order.
Avoid holding months of slow stock simply to receive a wholesale discount. Compare the discount with cash tied up, damage risk and the chance of a price decline. Reassess when competitors, seasons or sourcing costs change.
Watch for red flags hidden behind an attractive rate
A promising product may still be unsafe or unprofitable to sell. Common red flags include inconsistent brand authenticity, prohibited or restricted categories, unclear provenance, unusually high return rates, fragile shipping, hazardous-material handling requirements, stolen or counterfeit stock, and costly accessories missing from the supplier lot. Check applicable eBay rules and local regulations before purchase.
Another warning is a small market with a few extraordinary sales. If the rate is high only because current active supply briefly fell, do not assume that shortage will persist. A supplier may flood the market next week. If sold prices are trending down, model a conservative exit price rather than last month’s peak.
Also consider opportunity cost. Capital spent on a speculative slow item cannot fund a proven replenishment line. Set a maximum test budget, define a review date, and have a liquidation plan before buying. The purpose of research is to improve decisions, not to eliminate every uncertainty.
Connecting stock choice with the listing’s actual buyer experience
Even a product with convincing market demand can sell slowly if its listing is difficult to understand. Once the inventory is purchased, the seller must communicate correct product identity, condition, dimensions, compatibility, included items, shipping and return terms. Buyers compare specific offers, not abstract market statistics.
A good description should lead with verified facts, then provide a simple specification structure. Where useful, show relevant alternatives or related items without distracting from the main purchase. To diagnose a product that receives visits but not orders, read our guide to template design and sales conversions. It addresses the on-page stage after demand research has identified worthwhile stock.
BoostOnTime ETB supports the next step through responsive Descriptions and Specifications modules, dynamic information from each existing listing and reusable category layouts. It does not provide the market sell-through calculation or decide what to source. Separate the research tool from the listing-presentation tool so an appealing page never substitutes for proven demand.
A thirty-day stock-selection and validation plan
- Days 1–3 — Define opportunities: Select a focused set of candidate SKUs and document exact identities, supplier cost, condition and quantity available. Exclude products with unresolved compliance or authenticity concerns. Limit the shortlist so research remains careful.
- Days 4–7 — Research demand: Use eBay Product Research and completed-sales evidence. Record the same ninety-day research window where possible, actual sold prices, active competition, seller concentration and category seasonality. Calculate an explicitly labeled DIY proxy only if you need a supplementary comparison.
- Days 8–10 — Model unit economics: Estimate fees, shipping by destination, packaging, testing, expected returns and labor. Run base, downside and upside prices. Discard stock that cannot produce acceptable margin under realistic assumptions.
- Days 11–14 — Place a small test buy: Negotiate a limited first quantity. Inspect goods and verify the supplier’s claims. Build condition and photography standards before listing. Do not commit your entire purchasing budget to a single attractive rate.
- Days 15–20 — Publish accurate listings: Complete native eBay categories, titles, specifics, condition, images and pricing. For repeatable descriptions, build a category-specific layout in BoostOnTime ETB and test its dynamic product information on a small group using Batch Revision. Confirm real stock and variation choices.
- Days 21–27 — Observe real interest: Track impressions, views, questions, offers, units sold and contribution margin. Separate early indicators from proven demand. Do not discount immediately after a handful of visits unless the original research clearly supports a different price.
- Days 28–30 — Decide: Reorder only when observed sales and remaining margin justify it. Record what the test revealed about demand, operations and returns. If the item did not work, decide whether the issue was market selection, offer quality or execution before making the next purchase.
How BoostOnTime ETB fits the sourcing-to-selling workflow
A reliable eBay sourcing process has two different jobs: choose stock with evidence, then present each product consistently and accurately. eBay Product Research, completed sales and your own inventory records serve the first job. BoostOnTime’s eBay Template Builder (ETB) serves the second. It does not calculate eBay’s market sell-through rate, forecast demand or replace profit analysis.
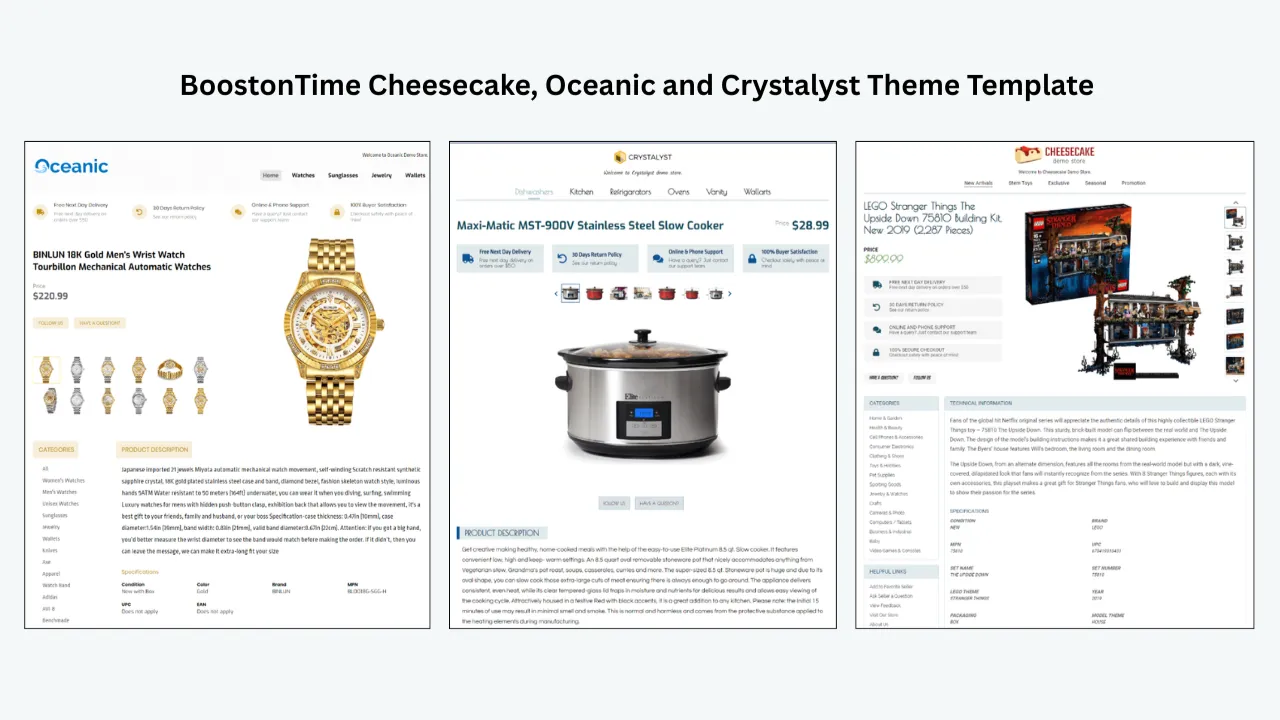
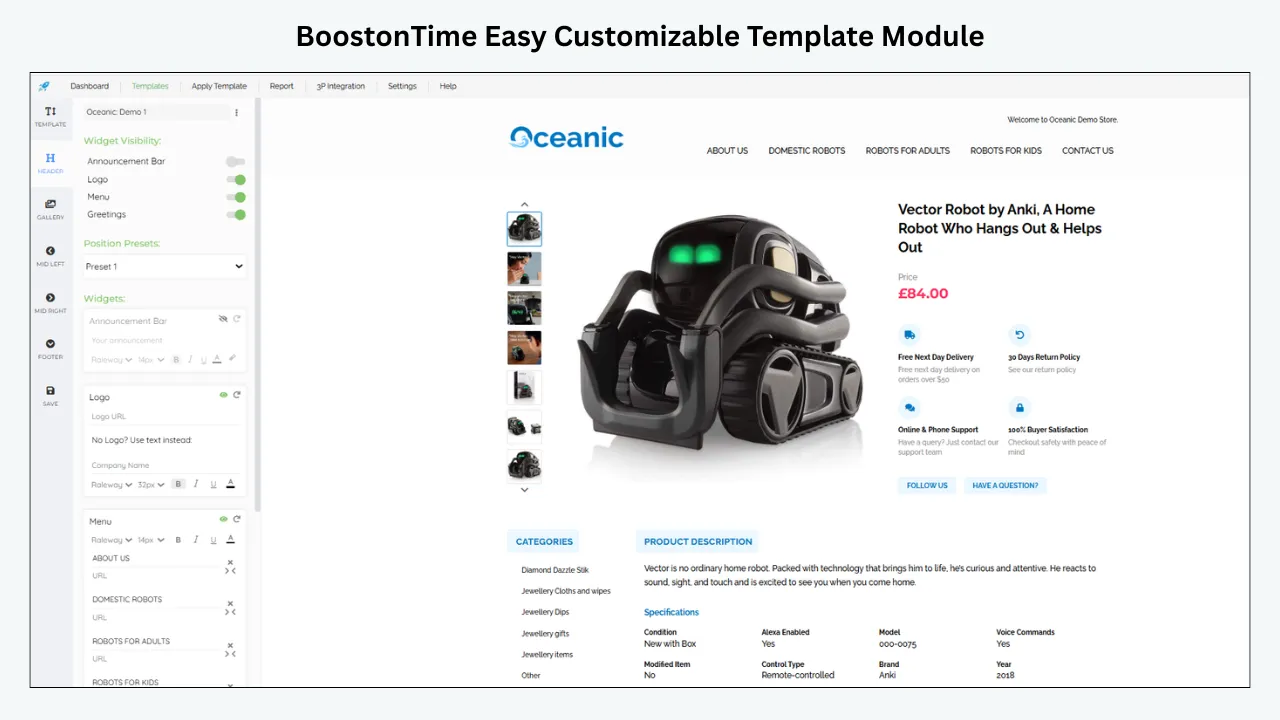
After you validate demand and buy a small test quantity, ETB helps turn the new inventory into a repeatable buyer experience. Rather than create fresh description HTML for every listing, select a responsive theme—Cheesecake, Oceanic or Crystalyst—and save layouts that suit each product family. The platform offers 20+ customizable modules, so an automotive-parts template can emphasize exact specifications while an apparel template emphasizes measurements, condition and care.
A practical implementation sequence looks like this:
- Verify the item first. Enter accurate native eBay titles, photos, item specifics, condition, price and available quantity. Correct errors before any import.
- Choose useful ETB modules. Make Descriptions, Specifications and Gallery easy to scan. Add Policy Tabs or Why Us only when their information is current and relevant.
- Separate shared from unique data. Use static modules for approved logo, store information and common policy wording. Dynamic modules can populate supported product information—including titles, prices and photos—from the individual listing.
- Cross-sell carefully. Where it helps, use Related Products to show a compatible alternative or complementary item. ETB allows seller-selected or randomized items; manually curated recommendations usually make more sense for fitment-sensitive products.
- Pilot, then expand. Preview the design on mobile, apply it to a few eligible existing listings through Batch Revision, inspect the live result and only then update a larger category group.
Imagine a seller researching three replacement-part SKUs. The market-rate calculations determine which SKU deserves a test purchase. Once purchased, a saved ETB parts template ensures that connector type, dimensions and compatibility appear in familiar positions across the range. The research decision and the presentation decision reinforce one another but should never be treated as the same metric.
See the BoostOnTime ETB modules and seven-day free trial or our template customization guide to build a maintainable workflow. Measure actual listing views, transactions, net profit and inventory turnover afterward. Strong presentation can help buyers evaluate viable products; it cannot create demand for stock that should not have been purchased.
Calculate expected profit after all real costs
A supplier negotiation checklist informed by market research
Research becomes useful when it changes the purchase agreement. Before negotiating, decide the maximum landed cost compatible with your conservative selling-price scenario. Then ask whether the supplier can verify quantities, condition grades, authenticity, accessories, packaging and delivery lead time. If a lot contains mixed models or damaged units, calculate a realistic usable-unit rate rather than assuming every piece will command the headline price.
Use observed demand to choose the order size, not simply to push for a bigger discount. A supplier may offer a lower unit cost for five hundred pieces, but if the market supports only a few monthly transactions from sellers like you, the discount may be outweighed by storage and capital costs. Request a small pilot or staged deliveries when possible. If the seller refuses, that is a commercial risk to price into the decision.
Clarify the return arrangement for defective incoming stock, the paperwork that supports lawful resale, and who pays freight on rejected units. For branded products, verify the chain of supply and any applicable marketplace restrictions. A profitable spreadsheet is useless if products cannot be legitimately listed or fail condition inspections. Record negotiations and the assumptions used to approve the final order.
Keep a post-purchase feedback loop for future stock decisions
Every sourced item creates new evidence that generic marketplace research cannot provide. After listing, track days to first qualified view, days to first sale, accepted offers, realized sold price, gross contribution, returns and actual handling time. Compare those results with the assumptions in the original sourcing scorecard. Record whether slow sales arose from weak market demand, a poor price, inaccurate fitment, strong competition or execution problems.
Review test buys monthly. A product with excellent marketplace activity but a high return rate may need better grading or a different supplier. A slower item with reliable margin and low work may deserve occasional replenishment. Create a short ‘buy again / buy smaller / do not restock’ decision for each SKU family, with the evidence that led to it. This closes the loop between eBay Product Research and your real business.
For teams, use consistent product IDs and one shared definitions sheet. If one colleague calls sold-listing count a sell-through rate and another means internal unit turnover, the dashboard will invite bad decisions. Clear terminology can be more valuable than adding another chart.
Make the decision resilient to an unexpected downside
Before placing a meaningful order, run a simple stress test. What happens if the achievable selling price is 15% lower than recent comparable sales? What if freight costs rise, ten percent of the units fail inspection, or the first order takes twice as long to sell? You do not need a sophisticated forecasting model: adjust each assumption in a spreadsheet and recalculate contribution and cash tied up.
If the purchase works only under perfect conditions, the sell-through evidence is not enough to make it safe. Prefer the opportunity that remains acceptable under a realistic downside case, especially when it is a new supplier or unfamiliar category. A disciplined buyer can pass on an attractive-looking rate without missing a genuine business opportunity.
Mistakes to avoid when using sell-through rate
Do not confuse a listing count with unit volume. One active listing can hold large quantities, while one sold listing might represent a single item. Do not compare a seven-day sold sample with a ninety-day one and call the percentages equivalent. Do not mix conditions, editions, pack quantities or marketplaces simply to create a larger sample. Do not treat an average asking price as a completed sale price.
Do not assume a high historical rate will continue forever. Changes in supply, consumer preferences, seasonality and product versions can make old statistics misleading. Do not ignore logistics and fees; low-cost, high-volume goods can consume more time than they return in margin. And do not reorder based solely on views or watchers when actual sales remain unproven.
Finally, do not let the perfect spreadsheet delay reasonable testing. Research should narrow uncertainty, then a controlled small purchase should test whether your own listing and operation can capture real demand. Combining quantitative evidence with modest inventory exposure is often wiser than either guesswork or overconfidence in a single rate.
Frequently asked questions about eBay sell-through rate
There is no universal percentage that makes every stock item a good purchase. Compare narrowly matched products using the same marketplace, dates and metric definition. A high rate may indicate demand, but margin, seller competition, seasonality, condition and shipping can outweigh it. Use the number as one part of a sourcing decision.
One rough research proxy is comparable sold-listing count over a defined period divided by comparable active-listing count at observation, multiplied by one hundred. Label the result a DIY proxy, not eBay’s official methodology. Because counts cover different moments and multi-quantity listings complicate supply, interpret it cautiously.
Yes. Historical sales may exceed the number of active listings visible on the observation date, especially in a frequently replenished market. That does not mean more than 100% of a fixed inventory pool sold. The ratio compares different measurements; clarify that in any sourcing report.
According to eBay’s current Help information, Product Research is available to sellers through Seller Hub and supported mobile experiences. Some separate sourcing tools have Store subscription requirements. Check your account’s access and the current feature set rather than confusing Product Research with a paid external analytics service.
Not in the same way it provides historical sales data. eBay states that Product Research offers up to three years of sales information, while sell-through is provided for searches of items sold ninety days ago or less. Use multi-year history for trend and seasonal context, and recent supported windows for that metric.
Market sell-through is about demand relative to some measure of marketplace supply. Your own unit sell-through tracks units sold relative to a clearly defined available inventory pool. Inventory turnover measures how frequently average stock is replaced or sold. All can be useful, but they answer different business questions.
No. Sold evidence is more meaningful than unsold asking prices, but a business also needs to evaluate current competition, acquisition cost, fees, shipping, condition, authenticity, returns, storage and its own selling capability. A small test buy is prudent when evidence is incomplete.
Your individual offer may have a weaker total price, slower shipping, less trust, incomplete compatibility information or poorer condition than the successful competitors. Check whether your inventory truly matches the researched market. Diagnose listing visibility, CTR and conversion separately before ordering more units.
BoostOnTime ETB is a description-template builder and batch revision tool, not eBay’s Product Research platform. Use eBay’s research capabilities and your own inventory records for the metric, then use a responsive template when you need to present purchased stock clearly and consistently to buyers.
Final takeaway: source demand, then earn the sale
A sensible eBay stock decision begins with evidence of actual transactions, not optimistic active prices. Learn which sell-through measure you are using, keep comparisons consistent and consider the entire economics of sourcing and fulfilment. Test unfamiliar products in small quantities, and monitor the real cash cycle before scaling.
After choosing viable inventory, make it easy to assess. Try BoostOnTime ETB for seven days to create reusable, mobile-responsive descriptions with accurate specifications and consistent branding. Keep market research in eBay’s research tools, and use ETB to present the stock you have already justified buying.
boostontime.com/ebay-template-builder